Niilo KeinänenHow to win Kongming solitaire in 3 attempts feat. software developerI had an interesting hobby programming adventure recently. My girlfriends parents introduced me to a rudimentary puzzle game. They called…8 min read·Dec 29, 2022----
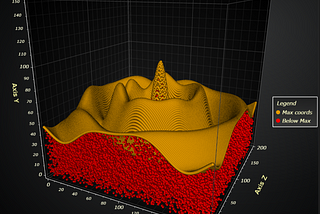
Niilo Keinänen5D data-visualization with LightningChartGenerally, data-visualization is used to display proportions of different values graphically in order to make it easier for humans to…3 min read·Aug 22, 2021--1--1
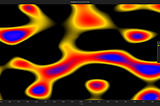
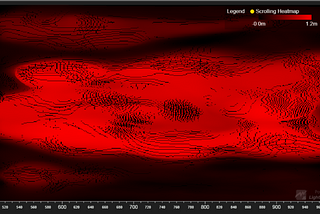
Niilo KeinänenHigh performance heatmap data-visualization in webI recently performed a comparison of a handful of most popular and well-known web data-visualization libraries in the context of heatmap…4 min read·Aug 12, 2021----
Niilo KeinänenJavaScript server side data visualization with LightningChart JSEven though JavaScript has a strong standing in both client and server software, when it comes to server side data visualization it seems…4 min read·Jun 13, 2021----
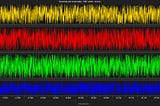
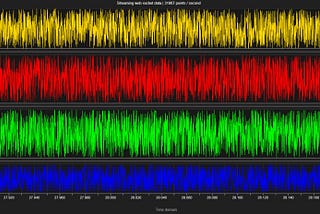
Niilo KeinänenReal-time data visualization with WebSocketWeb based data visualization technologies are currently living an era of change, as more and more users require native web solutions…3 min read·Jun 5, 2021----
Niilo KeinänenNovel method of 3D geometry visualizationThis week me and one colleague were playing with the idea of visualizing sonar data (we both work in development of data visualization…3 min read·May 29, 2021----
Niilo KeinänenWell written article, Nick.Another take at this problem is hardware accelerated data visualization, the next level in the field that takes you from drawing thousands…1 min read·May 22, 2021----
Niilo KeinänenEver wondered how those fancy trading charts are created?Even if you never watched The Wolf Of Wall Street, surely everyone has come across a fancy looking trading chart or dashboard once in…3 min read·Oct 1, 2019----